Data visualization is a powerful tool. It can show information in a way that tables of numbers simply can't and provides a high-impact view of what's happening at a glance. But it's also a double-edged sword. Because it is necessarily selective in order to make a point about what's happening, data visualization will also tend to hide other aspects of the larger truth behind the thing being visualized. And this can happen even with the best of intentions.
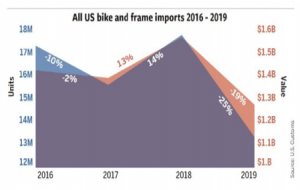
Case in point, last month's column, which featured the BRAIN chart shown at right with data courtesy of the US Customs department, shows a significant drop of both units imported (-25%) and the value of those units (-19%) in the period from 2016 to 2019. And that drop is pretty alarming.
I talked at the time about how the 2019 import picture is affected by inventory carried over from 2018 and the hesitancy to order more new product, especially e-bikes, in light of the Trump administration's ongoing tariffs on Chinese goods.
But what that chart doesn't show is exactly how significant 2019 is in the larger scope of things.
Getting the bigger picture
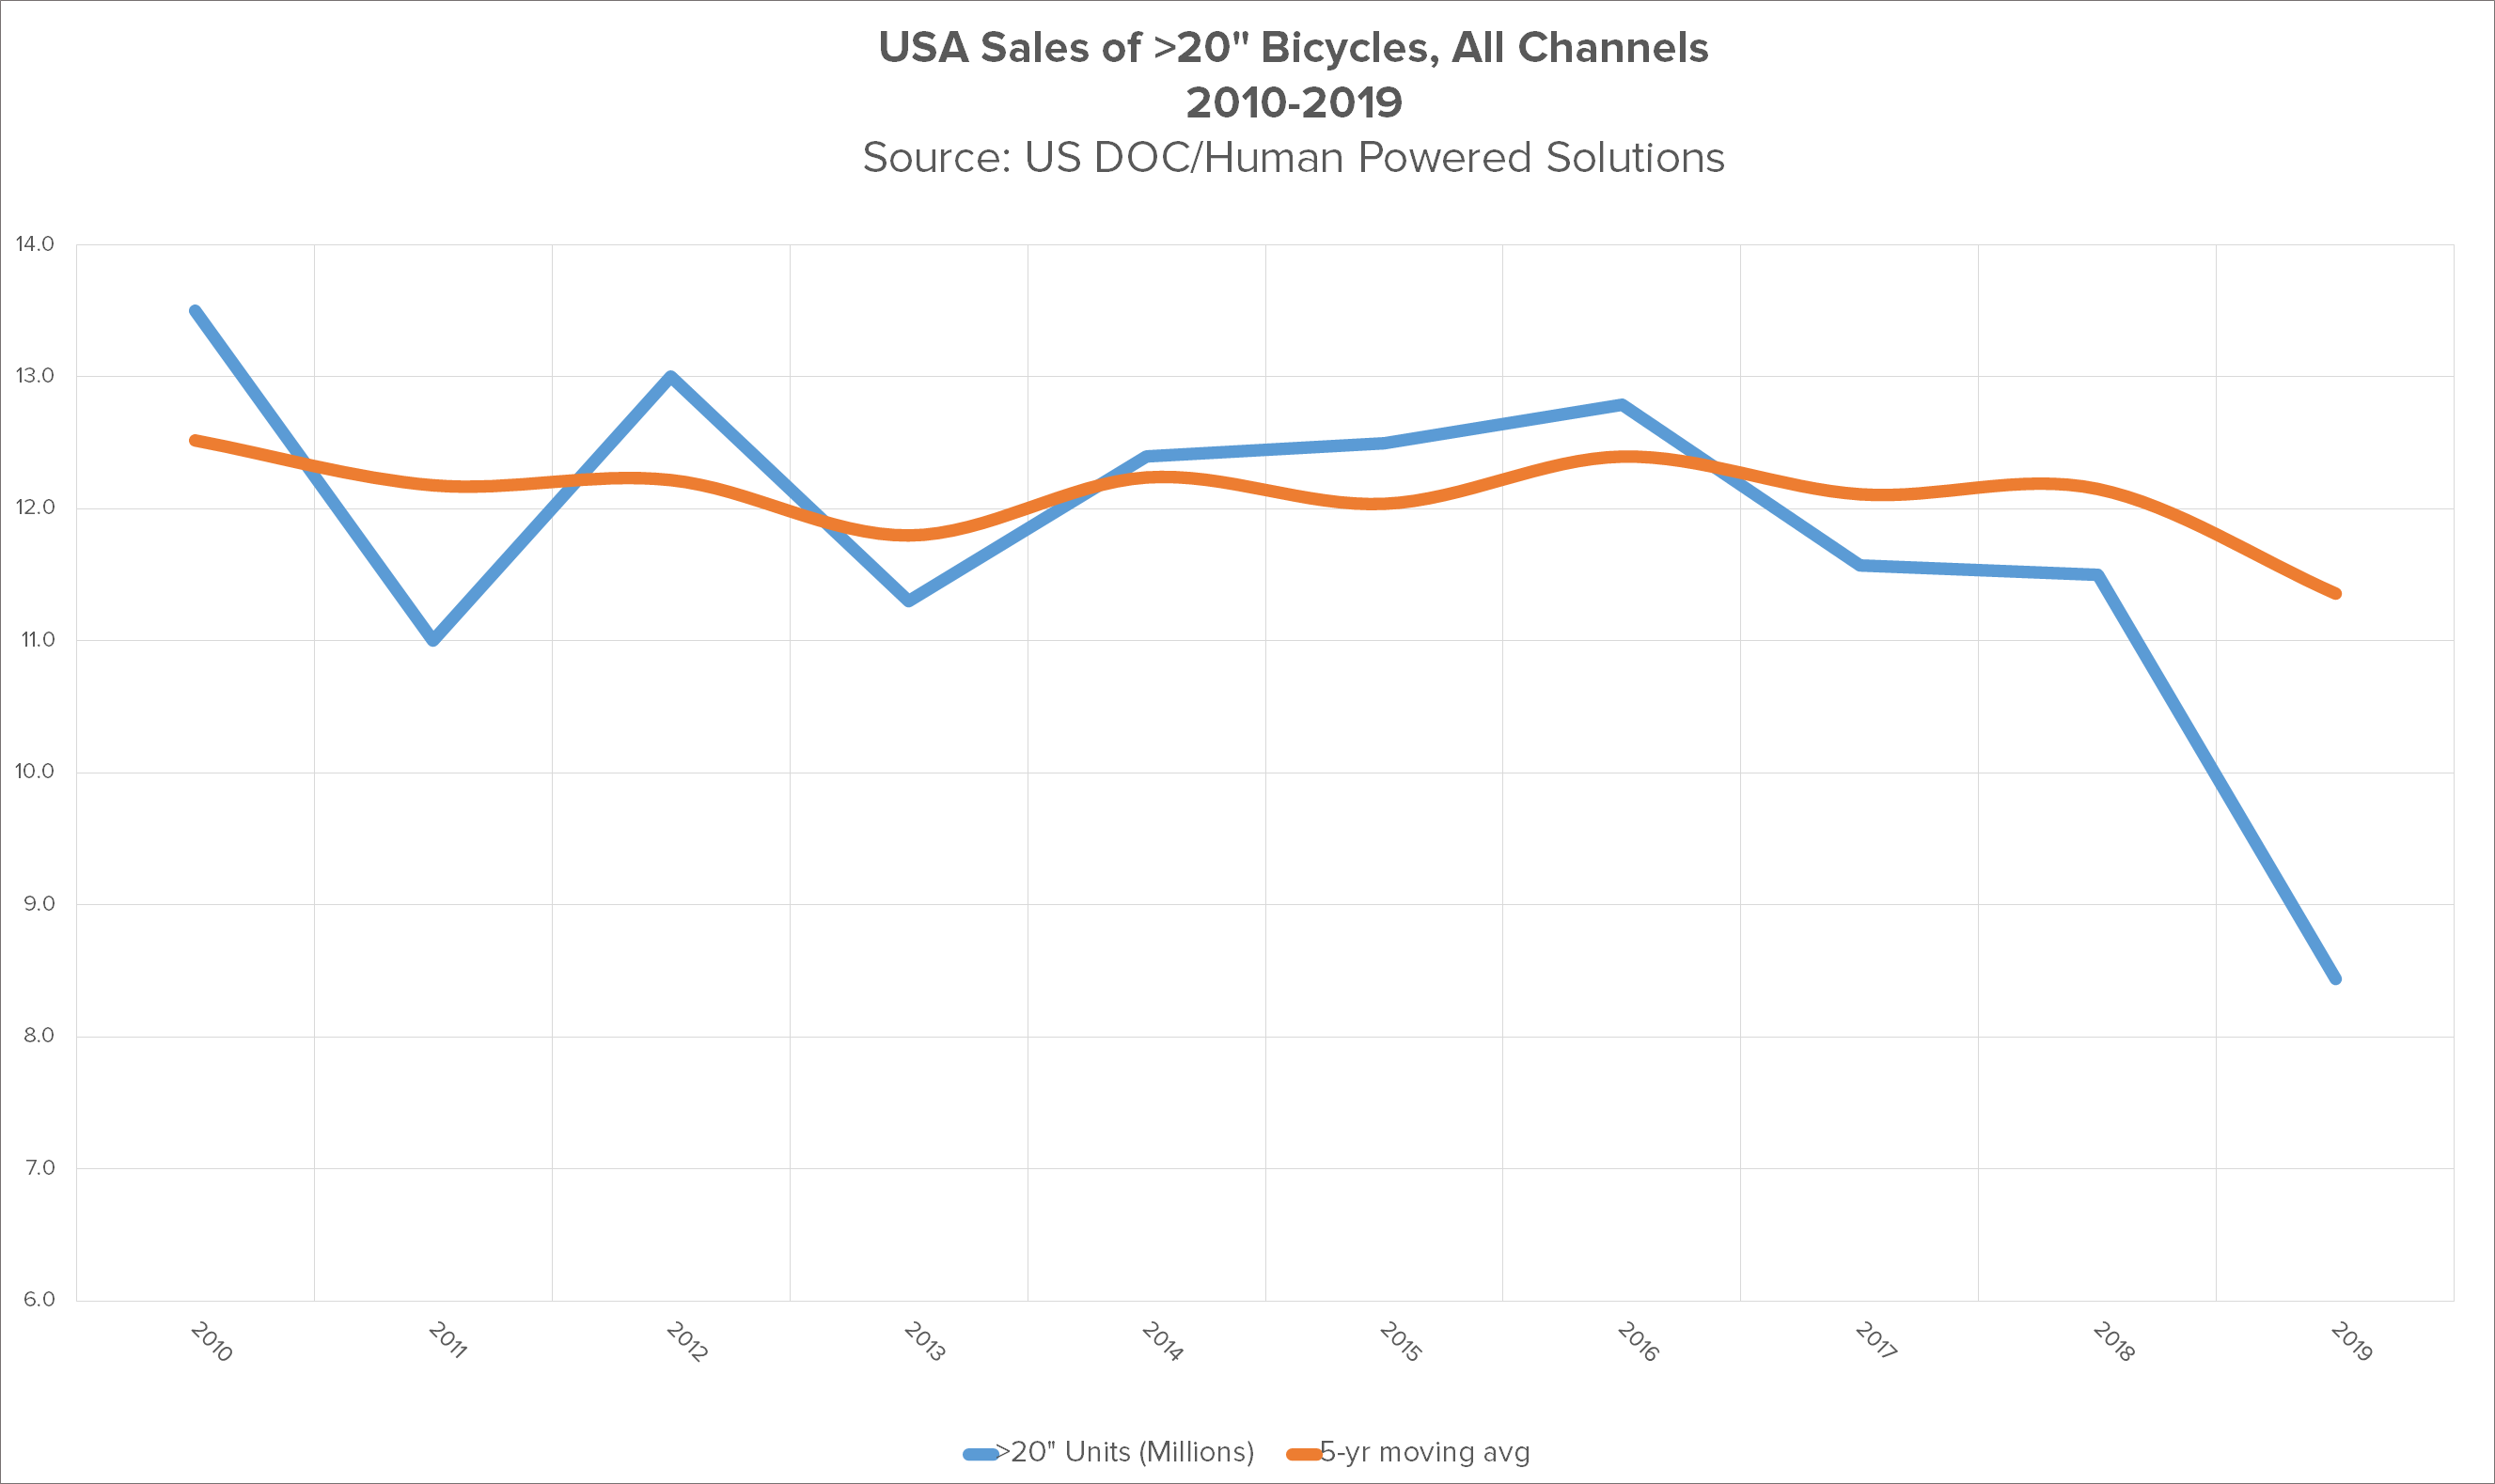
It's no secret that things have been flat since the Great Recession. Whatever growth has occurred in the specialty retail channel has happened as a result of increased ticket price on individual bikes, not because of overall increased demand. Note this chart is only for 20" and larger wheel sizes, while the previous one was for all wheel sizes; cutting the kids bikes out of the picture helps gives us a better idea of the specialty retail market segment.

The reduced imports in 2019 is not just a 25% reduction in units from 2018, but the lowest quantity of imports in the past 10 years, and a 31% drop from the 2010 – 2018 average of 12.2 million units.
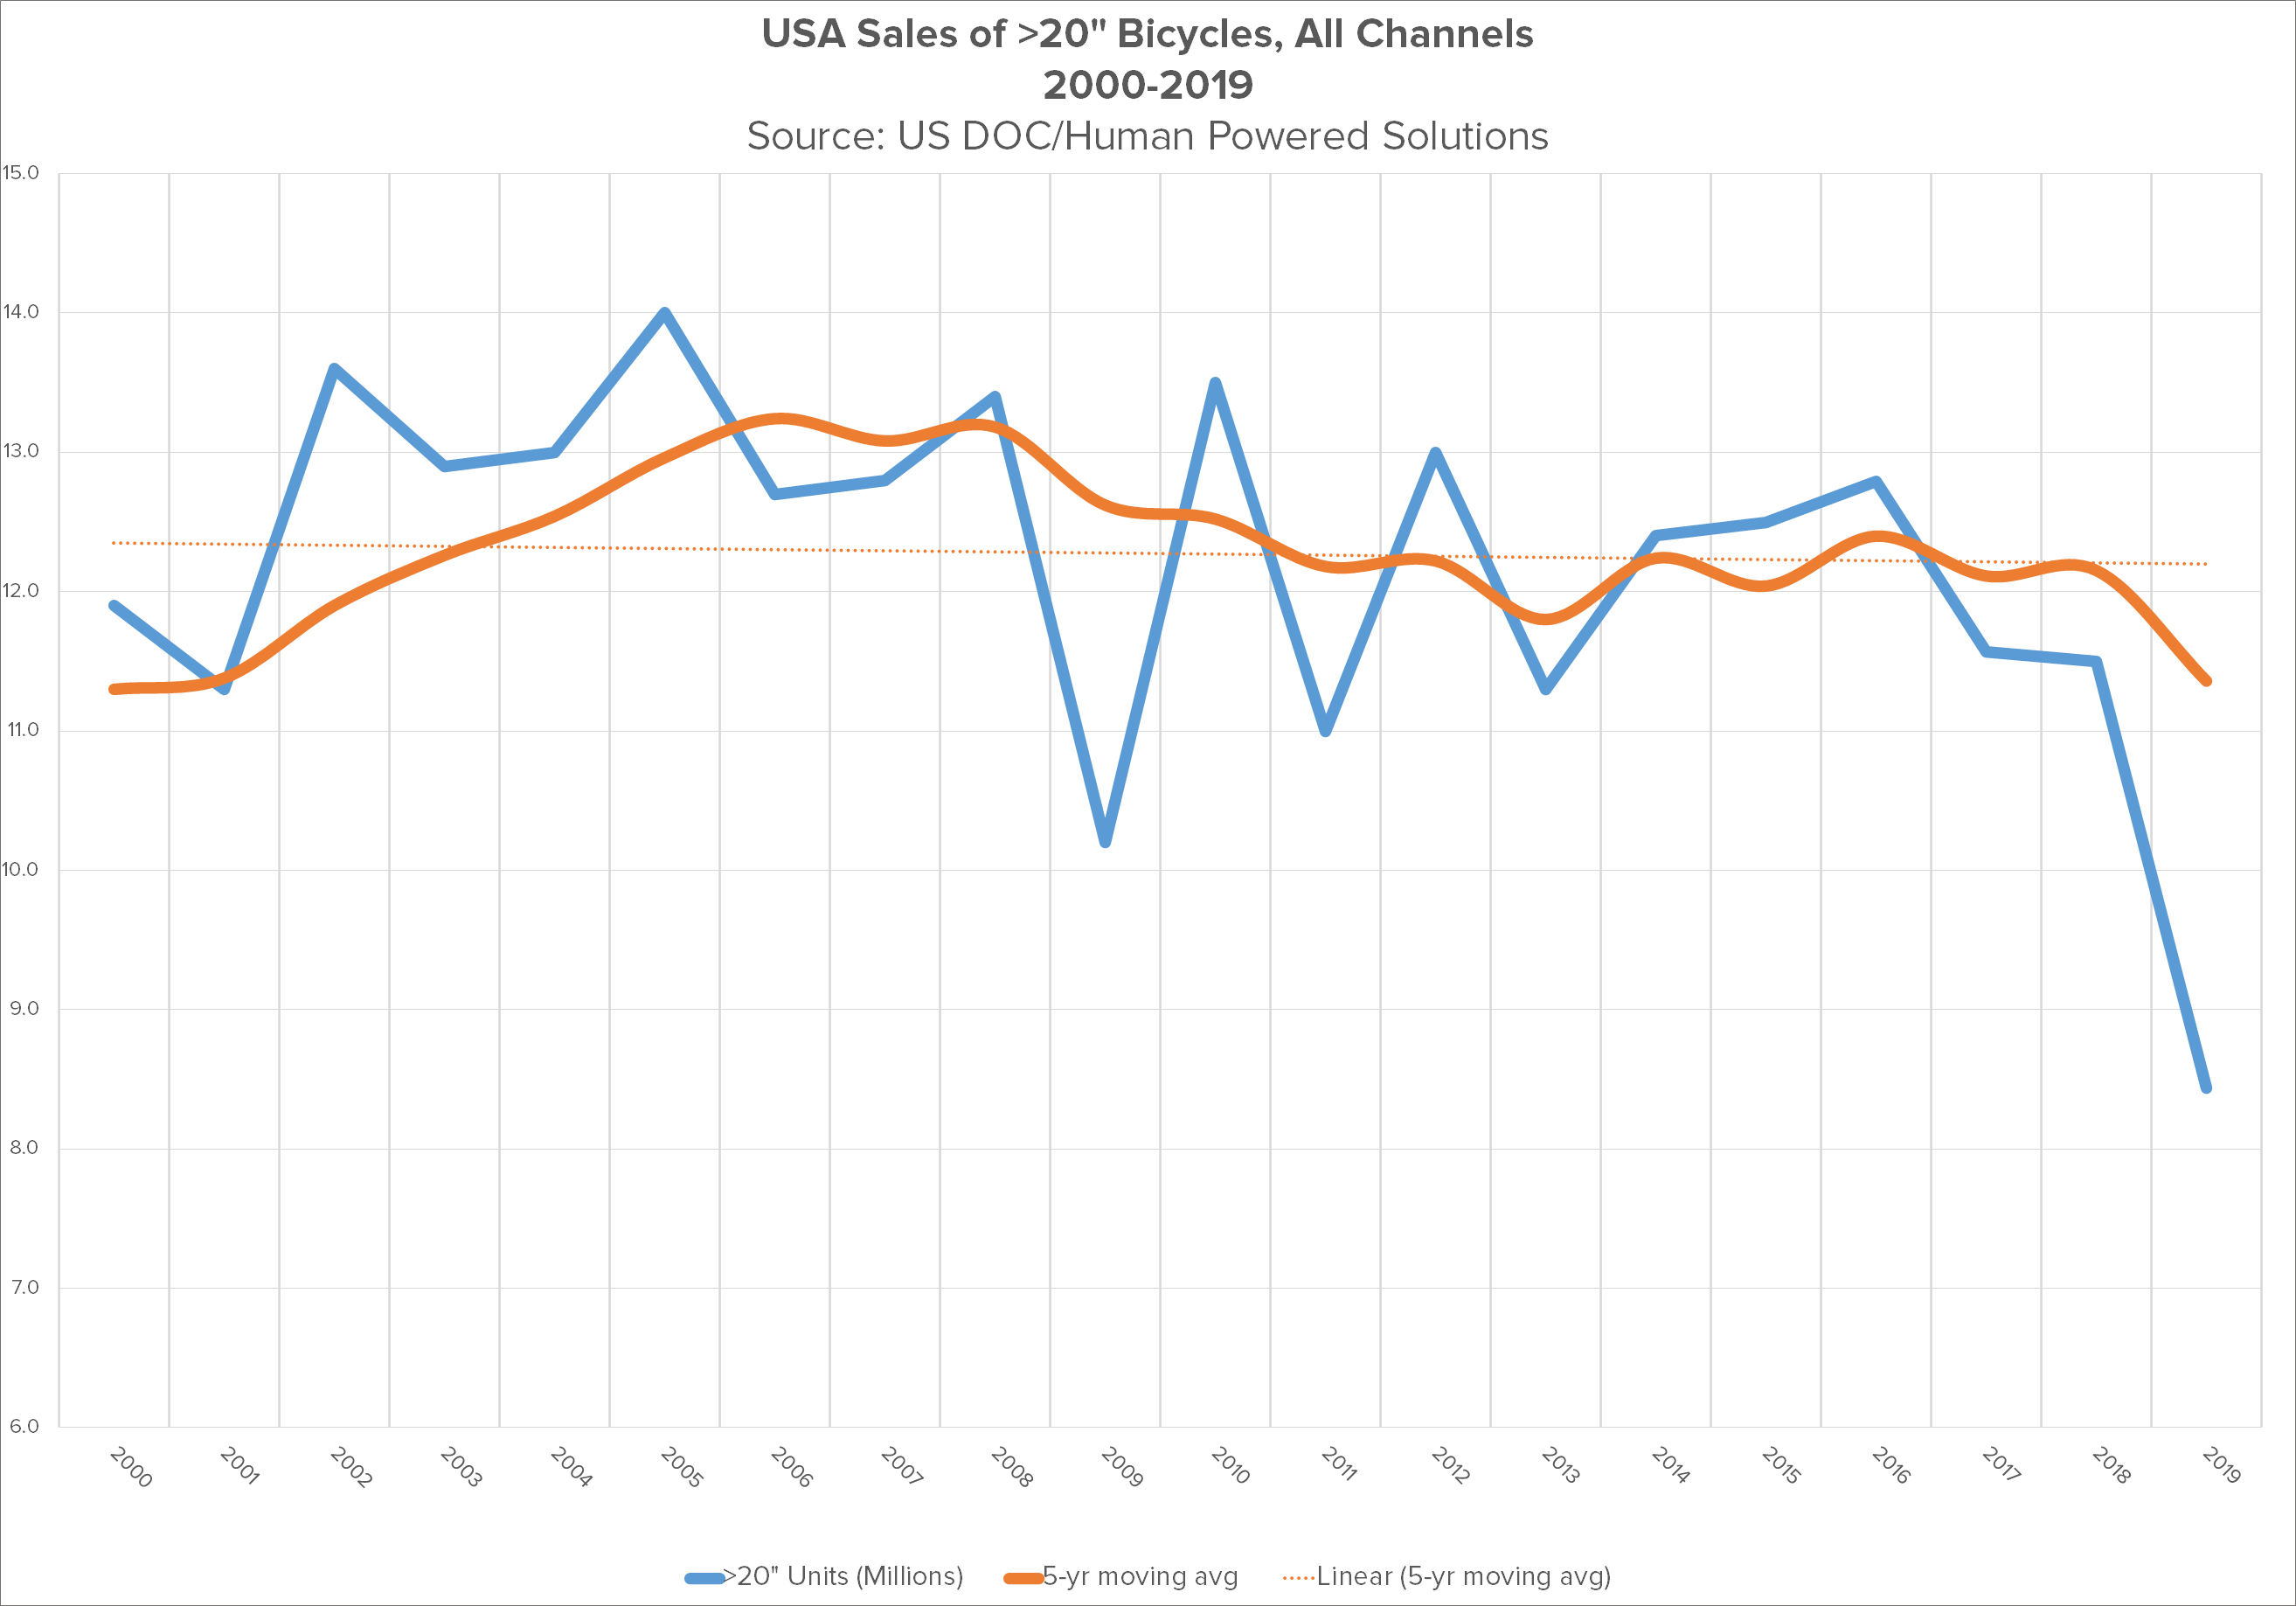
But let's zoom out a little farther and look at the 2019 import numbers in the context of the Bike 3.0 era, roughly 2000 to present:

This 2--year view gives us a little more perspective. We can clearly see Road Bike Boom from 2001 – 2006, the huge downward spike in 2009 from the Great Recession, the herky-jerky recovery attempts that led to so much price instability in the mid-decade, and the gradual flattening of the five-year moving average from there until the 2019 drop-off.
This shows 2019 was not just the worst year for imports in the ten years, it was the worst year for imports in the present era of our industry.
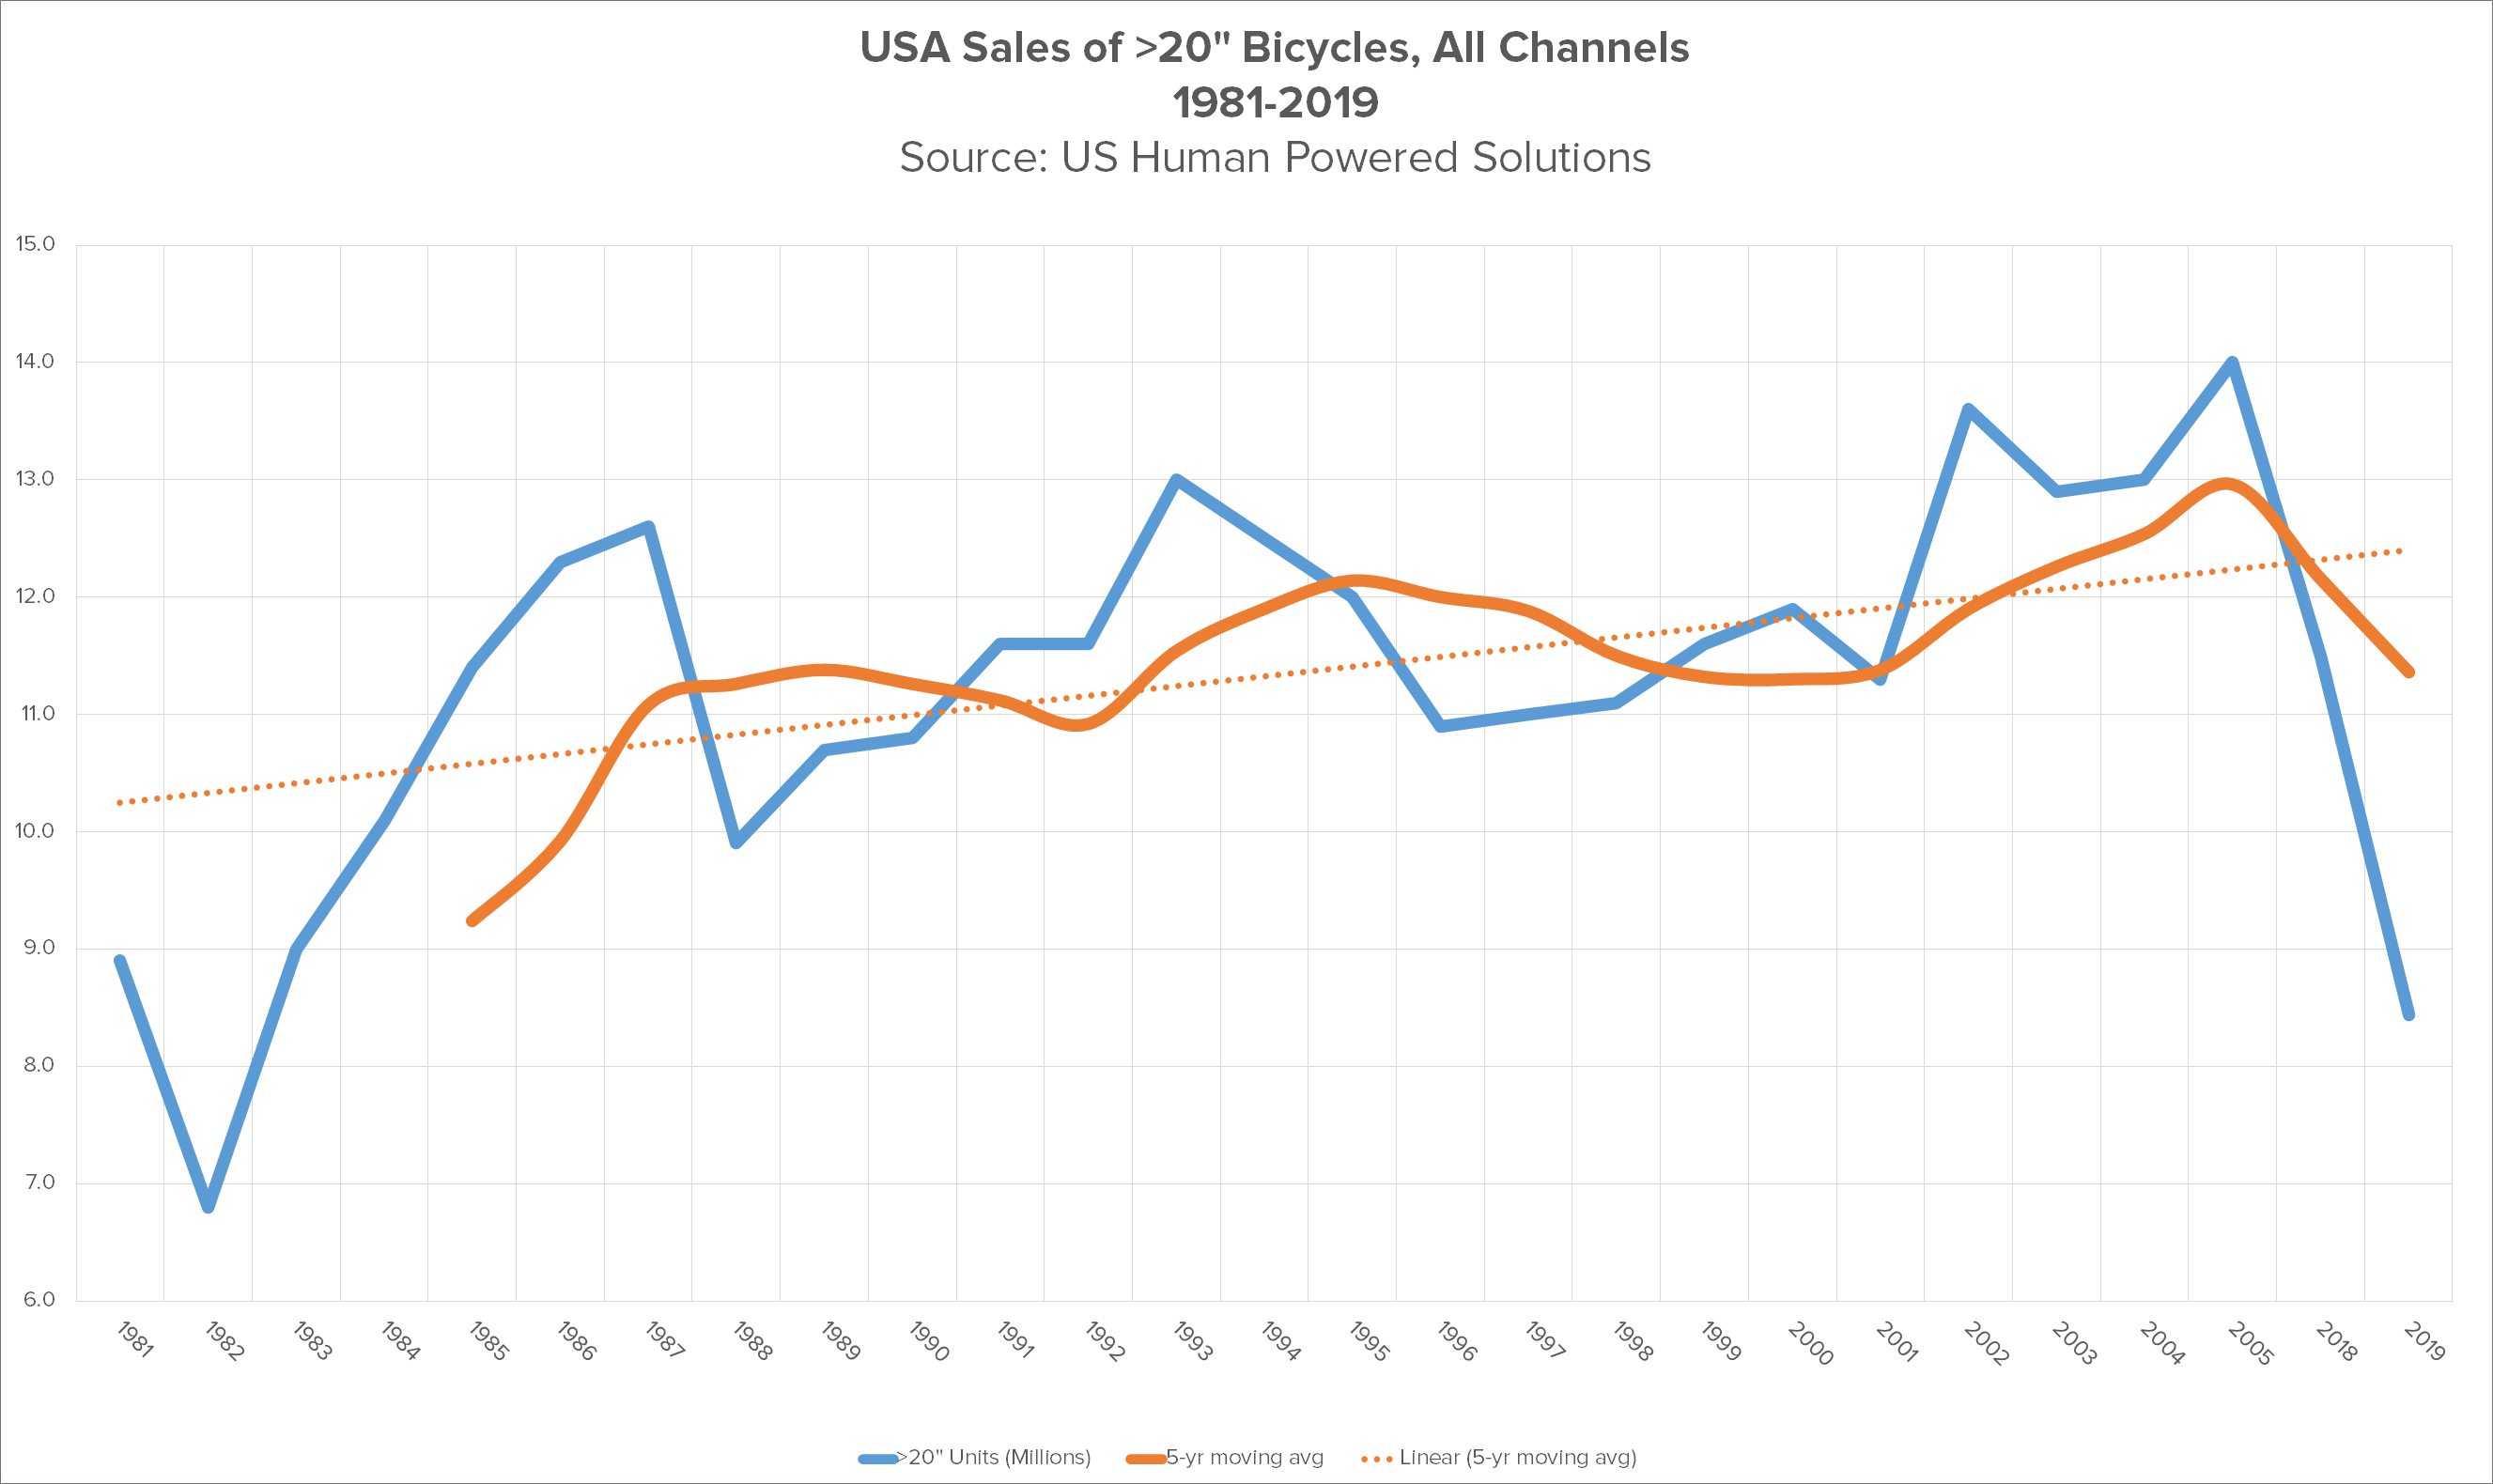
But let's zoom out still farther, to the end of the Seventies Bike Boom, the start of the Bike 2.0 era.

This chart illustrates how the Mountain Bike Boom saved us in 1983–1986; the rise of front and full suspension in 1988 – 1996, and the second Mountain Bike Bust until 2000, when road bikes came back into popularity. But more to the point, it shows that 2019 was the worst year for imports since the beginning of the mountain bike era nearly forty years ago ... since before many BRAIN readers were even born, much less working in the cycling industry.
That's a big drop, and possibly a 40-year watershed moment in the history of the industry.
Getting the perspective on the perspective
Is the 2019 drop off merely a particularly egregious market correction, brought on by years of product oversupply and the weight of tariffs? Or is it a fundamental shift in the overall industry paradigm?
My money is on the latter proposition, but until the industry has moved past the once-in-in-a-lifetime changes wrought by the coronavirus crisis, there's really no way to tell.
Rick Vosper has been helping companies in the bicycle business solve marketing problems since 1989. Email rick@rvms.com for a free consultation.


