WASHINGTON (BRAIN) — After steep declines in 2022 and 2023, the number of non-electric bikes imported last year increased 16.7% to 11.1 million units, according to import statistics released Wednesday.
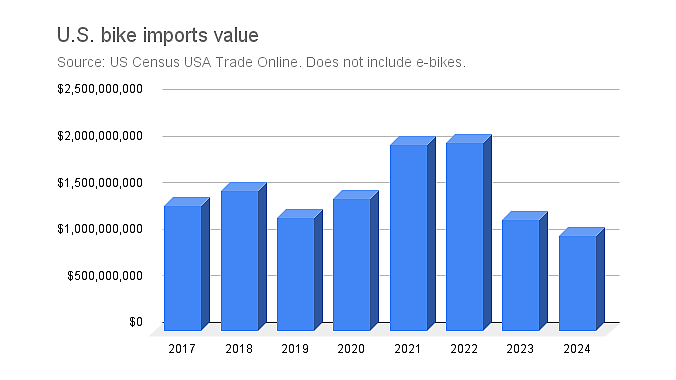
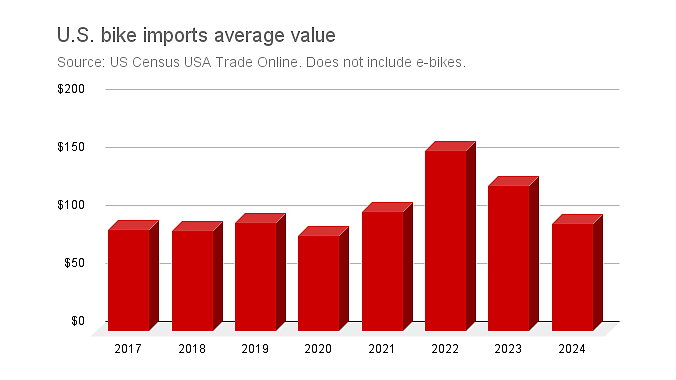
While the number of bikes imported increased, the value of those bikes declined 14% as the average imported value per bike declined steeply, from $126 in 2023 to just $93 last year.
What about e-bikes? It's difficult to track import of them because the U.S. does not have a single HTS import code for e-bikes. Instead, they share codes with electric motorcycles and other electric cycles. Several independent groups estimate the number of e-bikes imported and sold, sometimes accessing shipping manifests and identifying containers by context, a cumbersome and inexact process. Peter Woolery of Bicycle Market Research estimated 2024 e-bike imports at about 1.5 million units, up from 1.3 million in 2023.
The official import data also does not include any bikes or e-bikes imported under the $800 de minimis threshold.
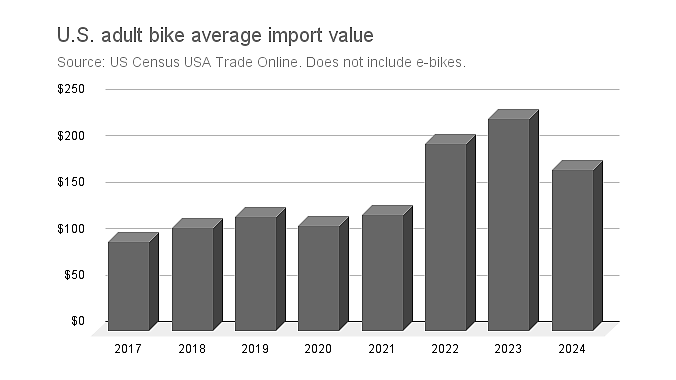
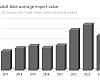
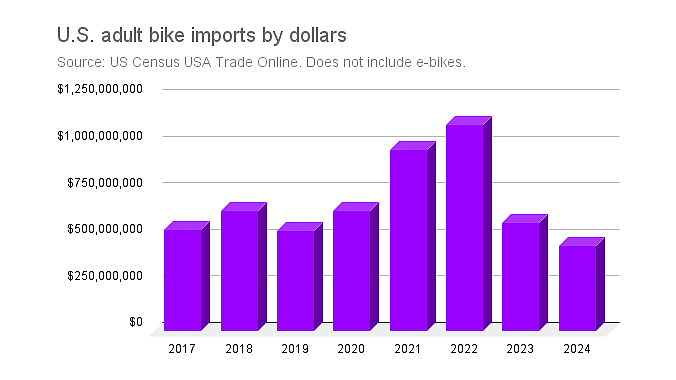
The statistics are heavily influenced by the large number of very low-priced bikes imported by mass merchants. To reduce that impact, some analysts filter out all juvenile bike imports, to get a better view of the kinds of bikes imported for the speciality retail market. Looking at adult-bike imports alone, the number declined just 2.9% from 2023, to about 2.6 million units. That followed a 53% decline in adult bike imports the year before. The dollar value declined 21%, after a 47% decline the year before.

In May the Biden adminstration announced that importers of China-made bikes would no longer be excluded from the 25% Section 301 tariffs first imposed by the first Trump administration. The exclusions expired on June 14. That news might have curtailed imports from China for the remainder of the year, although some importers may have been betting on even higher tariffs to come if Trump was re-elected. He was, and this week he imposed an additional 10% tariff on Chinese products, bringing the total tariff on Chinese mountain bikes and kids bikes to 46%.
Watch for more analysis of these import numbers in the March issue of Bicycle Retailer & Industry News.
| Year | Dollars | Units * | Average value | Unit change | Dollar change | Average value change |
| 2017 | $1,342,425,921 | 15,347,887 | $87 | |||
| 2018 | $1,509,577,877 | 17,371,201 | $87 | 13.18% | 12.45% | -0.65% |
| 2019 | $1,220,668,551 | 13,063,322 | $93 | -24.80% | -19.14% | 7.53% |
| 2020 | $1,422,615,018 | 17,235,171 | $83 | 31.94% | 16.54% | -11.67% |
| 2021 | $1,995,075,733 | 19,438,172 | $103 | 12.78% | 40.24% | 24.35% |
| 2022 | $2,023,969,831 | 13,037,723 | $155 | -32.93% | 1.45% | 51.25% |
| 2023 | $1,194,030,549 | 9,509,634 | $126 | -27.06% | -41.01% | -19.12% |
| 2024 | $1,026,921,674 | 11,094,729 | $93 | 16.67% | -14.00% | -26.28% |
| * All non-electric bikes |
| Year | Dollars - Adult bikes | Units - Adult bikes | Average value | Unit change | Dollar change |
Average value change
|
| 2017 | $544,013,362 | 5,665,136 | $96 | |||
| 2018 | $648,477,956 | 5,806,902 | $112 | 2.50% | 19.20% | 16.29% |
| 2019 | $540,945,534 | 4,391,194 | $123 | -24.38% | -16.58% | 10.31% |
| 2020 | $646,607,702 | 5,708,448 | $113 | 30.00% | 19.53% | -8.05% |
| 2021 | $974,409,478 | 7,740,218 | $126 | 35.59% | 50.70% | 11.14% |
| 2022 | $1,104,887,923 | 5,464,521 | $202 | -29.40% | 13.39% | 60.61% |
| 2023 | $581,885,732 | 2,547,997 | $228 | -53.37% | -47.34% | 12.95% |
| 2024 | $457,160,184 | 2,622,246 | $174 | 2.91% | -21.43% | -23.66% |
|
*Adult non-electric bikes
|

-
-
-
 The number of adult bikes imported was up 2.9%
 -
-